/ MicroSoft SQL Server

SQL Buffer Pool

SQL Server retrieves data from two areas; memory and disk. As disk operations are more expensive in terms of IO which means they are much slower SQL stores and retrieves data pages from an area known as the Buffer Pool where operations are much faster.

In order to understand how the Buffer Pool works and how it benefits our query processing we need to see it in action. Fortunately SQL Server gives us several management views and built in functionality to see exactly how the Buffer Pool is being used and how, or more importantly if, our queries are utilising it efficiently.

Firstly, we need to ensure we have a cold cache to work with; that is a Buffer Pool that is not populated with any pages. We can do this without restarting SQL Server by issuing a DBCC, or Database Console Command entitled DROPCLEANBUFFERS. Prior to doing this we need to issue a CHECKPOINT command, this ensures that any dirty pages are wrote to disk cleaning the buffers, for reference a buffer is a 8 kilobyte page residing in memory.

The following message is displayed:
DBCC execution completed. If DBCC printed error messages, contact your system administrator.
As I covered in a previous post Monitoring Memory Clerk and Buffer Pool Allocations in SQL Server we can see how the Buffer Pool is allocated by using the sys.dm_os_memory_clerks Dynamic Management View:


If we run this as soon as our Buffer Pool has been flushed we will see the results of our query that similar to the image below:
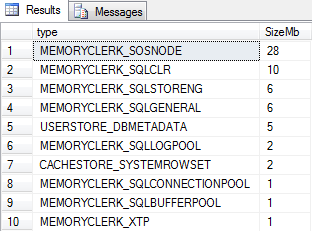
Here we can see some of SQL Servers current memory allocations and it’s important to understand that although we have flushed the Buffer Pool there are still other things using memory like the SQLOSNODE, CLR and storage engine clerks amongst others, in fact the Buffer Pool itself isn’t at zero but actually has a 1Mb allocation.
This is important to know because in some way it relates to our Maximum server memory setting in SQL Server (as show below).
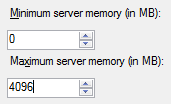
This is a screenshot from the server properties of my test instance. This setting isn’t actually the total memory that SQL is allocated, it’s just for the Buffer Pool allocation. This is why you might see SQL Servers memory usage in the likes of Windows Task Manager going above this specified limit from time to time.
To see the Buffer Pool in action we need to run some queries and its best to use a table with a relatively high row count; I’m going to use a TOP command to return 10000 rows from one of my test tables. I am also going to use the SET STATISTICS IO ON command so I can see how SQL Server is retrieving the rows.


By clicking the Messages tab we can see how SQL has ‘read’ the data.

In this case there are 61 logical reads and 1 physical read. The logical reads are those taken from cache and the physical read is from disk. As memory is much, much faster than disk then the more logical reads the better.
The read-ahead reads are due to an optimisation within SQL Server that pre-fetches pages from disk into cache. Now if we view the memory clerk allocations again we should see a difference in the Buffer Pool allocation.
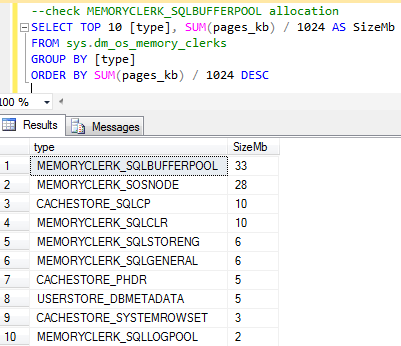
Now we can see that the MEMORYCLERK_SQLBUFFERPOOL allocation is at 33Mb and to show how this benefits our queries we’ll leave the SET STATISTICS option on and run the query once again and examine the reads:



Now we can see that SQL has not had to read or pre-fetch any pages from disk, all of our pages have been read from the cache/Buffer Pool which is a much faster form of data retrieval which clearly benefits our queries. As we haven’t had to perform any further population of the Buffer Pool, we’ve re-used pages then the memory clerk allocation will remain the same.
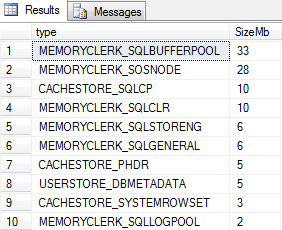
We can see that from a cold cache our query of 10000 rows has quite naturally needed to fetch pages into the Buffer Pool via disk during execution but the key point is that the subsequent executions of the query have not used disk but have reused the stored pages.
This is a high-level example of how SQL Server has been designed to store and retrieve data efficiently utilizing the Buffer Pool.
It’s worth noting at this point that the execution times for both runs of the TOP 10000 query were identical even though we know that one has used the must faster cache and one used disk a lot more. This is down to the relatively small result set but it also shows that execution time is not really a 100% accurate way of testing a queries efficiency compared to both cost and IO statistic values.
So going back to testing, what if we change our 10000 rows query to return 50000 rows this time?

Even though it is returning 5 times the amount of rows than the previous execution we aren’t seeing any of the reads or read-ahead reads coming from disk. However, the logical reads that were 61 in our previous execution are now at 229.
To understand why the query has been able to query more rows but still use cache we need to look at our IO statistics from the very first SELECT query that we ran:

This is all because of the earlier 4104 read-ahead reads; even though the pages were not required by the original query the mechanism has still pre-fetched a larger group of pages into memory than what the original query required.
In this example it has been a huge advantage to our subsequent queries, even when returning larger result sets, as they have utilised the pre-fetched cached pages rather than having use more expensive disk read operations.
In this instance we are using very isolated testing examples and on busier systems our Buffer Pool could be under constant modification as different pages are being read into cache. This is one reason why our queries should be finely tuned with good code practice and the likes of sensible indexing so that we use the smallest amounts of rows/pages possible.
The SET STATISTICS_IO ON option is a great way to see how our queries are utilising Buffer Pool or physical IO operations. If we see high disk usage then we know there may be an opportunity for tuning or that there may be instance level reasons why the Buffer Pool is not being used as efficiently as it could be.

TSQL Query to get AD level inactive logins

SET NOCOUNT ON;
declare @user sysname
declare @domain varchar(100)

set @domain = 'XXX"

declare recscan cursor for
select name from sys.server_principals where type_desc in ('WINDOWS_GROUP','WINDOWS_LOGIN') --and name not like 'NT %'
 and name like @domain+'%';
 DECLARE @TempTable TABLE( Name nvarchar(100))
open recscan
fetch next from recscan into @user
 DECLARE @group_members TABLE (
    account_name sysname,
    [type] sysname,
    privilege sysname,
    mapped_login_name sysname,permission_path sysname NULL
);
while @@fetch_status = 0
begin
    begin try
           INSERT INTO @group_members ( account_name,
        [type],
        privilege,
        mapped_login_name, permission_path
    ) exec xp_logininfo @user-- exec xp_logininfo @user
    end try
    begin catch
        --Error on xproc because login doesn't exist
       -- print 'drop login '+convert(varchar,@user)
      -- print @user
       INSERT INTO @TempTable (name) values(@user)

    end catch

    fetch next from recscan into @user
end

close recscan
deallocate recscan

select @@SERVERNAME, * from @TempTable

SELECT * FROM sys.configurations
WHERE name = 'clr enabled'

To verify NTFS cluster size 64k

powercfg -list


Get-CimInstance -ClassName Win32_Volume | Select-Object Label, BlockSize,FileSystem | Format-Table -AutoSize 

gwmi win32_volume -computer computername |Select-Object Label, BlockSize,FileSystem | Format-Table -AutoSize

To Find the SQL Port number

we can use below query to find out the sql port number in sql server 

 
USE MASTER
GO
xp_readerrorlog 0, 1, N'Server is listening on'
GO 

http://sql-articles.com/scripts/capture-sql-performance-counters-through-tsql/

http://sql-articles.com/scripts/capture-sql-performance-counters-through-tsql/
Waiting 60 second(s) before polling for further changes.

the merge process could not query the last sent and received generations

Error messages:
The merge process could not query the last sent and received generations. (Source: MSSQL_REPL, Error number: MSSQL_REPL-2147200929)
Get help: http://help/MSSQL_REPL-2147200929


SQL Server Network Interfaces: Error Locating Server/Instance Specified [xFFFFFFFF].  (Source: MSSQLServer, Error number: -1)
Get help: http://help/-1


A network-related or instance-specific error has occurred while establishing a connection to SQL Server. Server is not found or not accessible. Check if instance name is correct and if SQL Server is configured to allow remote connections. For more information see SQL Server Books Online. (Source: MSSQLServer, Error number: -1)
Get help: http://help/-1


Login timeout expired (Source: MSSQLServer, Error number: 0)
Get help: http://help/0


The merge process failed to execute a query because the query timed out. If this failure continues, increase the query timeout for the process. When troubleshooting, restart the synchronization with verbose history logging and specify an output file to which to write. (Source: MSSQLServer, Error number: 0)
Get help: http://help/0


Issue:

In SQL Replication Monitor is the following message.
 
The merge process could not query the last sent and received generations. (Source: MSSQL_REPL, Error number: MSSQL_REPL-2147200929)

Causes:

The Merge Agent on the Subscriber needs to be restarted.

Solution:

Log in to SQL Server Management Studio and connect to the Subscriber.

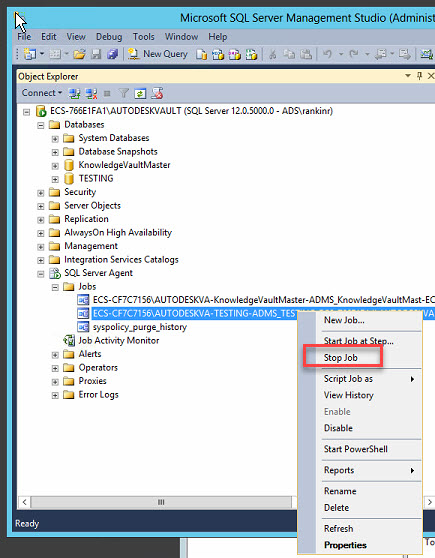
Under SQL Server Agent>Jobs, locate the database subscription that shows the above message.
Right click it and select "Stop Job".
User-added image

Then, expand Replication>Local subscriptions, find the database, right click it.
From the context menu, select View Synchronization Status.

User-added image
In the synchronization status screen select the 'Start' button

User-added image

SQL Query to get tempdb internal objects

SELECT
st.dbid AS QueryExecutionContextDBID,
DB_NAME(st.dbid) AS QueryExecContextDBNAME,
st.objectid AS ModuleObjectId,
SUBSTRING(st.TEXT,
dmv_er.statement_start_offset/2 + 1,
(CASE WHEN dmv_er.statement_end_offset = -1
THEN LEN(CONVERT(NVARCHAR(MAX),st.TEXT)) * 2
ELSE dmv_er.statement_end_offset
END - dmv_er.statement_start_offset)/2) AS Query_Text,
dmv_tsu.session_id ,
dmv_tsu.request_id,
dmv_tsu.exec_context_id,
(dmv_tsu.user_objects_alloc_page_count - dmv_tsu.user_objects_dealloc_page_count) AS OutStanding_user_objects_page_counts,
(dmv_tsu.internal_objects_alloc_page_count - dmv_tsu.internal_objects_dealloc_page_count) AS OutStanding_internal_objects_page_counts,
dmv_er.start_time,
dmv_er.command,
dmv_er.open_transaction_count,
dmv_er.percent_complete,
dmv_er.estimated_completion_time,
dmv_er.cpu_time,
dmv_er.total_elapsed_time,
dmv_er.reads,dmv_er.writes,
dmv_er.logical_reads,
dmv_er.granted_query_memory,
dmv_es.HOST_NAME,
dmv_es.login_name,
dmv_es.program_name
FROM sys.dm_db_task_space_usage dmv_tsu
INNER JOIN sys.dm_exec_requests dmv_er
ON (dmv_tsu.session_id = dmv_er.session_id AND dmv_tsu.request_id = dmv_er.request_id)
INNER JOIN sys.dm_exec_sessions dmv_es
ON (dmv_tsu.session_id = dmv_es.session_id)
CROSS APPLY sys.dm_exec_sql_text(dmv_er.sql_handle) st
WHERE (dmv_tsu.internal_objects_alloc_page_count + dmv_tsu.user_objects_alloc_page_count) > 0
ORDER BY (dmv_tsu.user_objects_alloc_page_count - dmv_tsu.user_objects_dealloc_page_count) + (dmv_tsu.internal_objects_alloc_page_count - dmv_tsu.internal_objects_dealloc_page_count) DESC

Script for SQL Job failures

SELECT  cast(serverproperty('Machinename') as varchar(255)) Servername,isnull(cast(serverproperty('Instancename') as varchar(255)),
cast(serverproperty('Machinename') as varchar(255))) Instancename,
    j.name AS JobName,
    Isnull(Substring(CONVERT(VARCHAR(8), js.last_run_date), 1, 4) + '-' +Substring(CONVERT(VARCHAR (8), js.last_run_date), 5, 2) + '-' +  Substring(CONVERT(VARCHAR( 8), js.last_run_date), 7, 2), '') AS [Run DATE]
         ,CASE
        WHEN j.enabled = 1 THEN 'Enabled'
        ELSE 'Disabled'
    END JobStatus
    ,CASE
        WHEN js.last_run_outcome = 0 THEN 'Failed'
        WHEN js.last_run_outcome = 1 THEN 'Succeeded'
        WHEN js.last_run_outcome = 2 THEN 'Retry'
        WHEN js.last_run_outcome = 3 THEN 'Cancelled'
        ELSE 'Unknown'
    END JobRunStatus
FROM msdb.dbo.sysjobs j
JOIN msdb.dbo.sysjobservers js on js.job_id = j.job_id
where j.name in('DatabaseBackup - SYSTEM_DATABASES - FULL',
'DatabaseBackup - USER_DATABASES - DIFF',
'DatabaseBackup - USER_DATABASES - FULL',
'DatabaseBackup - USER_DATABASES - LOG','DatabaseIntegrityCheck - SYSTEM_DATABASES',
'DatabaseIntegrityCheck - USER_DATABASES',
'IndexOptimize - USER_DATABASES','Update Log Growth Setting',
'UpdateStats CUSTOM DAILY - USER_DATABASES')-- and j.enabled=1
ORDER BY j.name, js.last_run_date, js.last_run_time  

Stolen Pages, Ad-hoc queries and the sins of dynamic SQL in the application.

/*
One of the great advantages of doing development work on SQL Server machines with very modest hardware specifications is that mistakes are visible. The mistake of doing ad-hoc dynamic queries from an application will  soon reveal itself. You might get a complaint from the developers that a database is running slowly. You’ll notice a very high CPU usage, up to 100% but without any blocking during the periods of slow performance.
In extreme cases, You may even receive errors such as
Error: 701, Severity: 17, State: 1
There is insufficient system memory to run this query.
  ..or..
Msg 8645, Level 17, State 1, Procedure , Line 1
A time out occurred while waiting for memory resources to execute the query. Re-run the query.
You may be seeing the effects of the running of too many ad-hoc queries. The high CPU can be due to the query optimiser compiling a large number of Ad-Hoc queries. The memory stress is due to the extra memory required to store these. In other words, some developer is spraying a large number of Ad-hoc queries at the database instead of using either stored procedures or prepared statements. the chances are, they’re doing something ‘suboptimal’ or, as we used to call it, Daft.
A compiled execution plan takes around 70KB depending on its size, and a stored procedure plan takes two to three times as much, depending on its complexity.  The difference is that there will be only one plan for each stored procedure. With ad-hoc queries, you run the risk of having a separate plan for each query. We’ll illustrate this in this article, and show you what to look out for.
Query plans have to be stored for re-use in the procedure cache, and SQL Server takes buffers from the LRU Buffer data store to do this. The word ‘stolen’ is a bit misleading as this is a perfectly legitimate exercise. Stolen pages are buffer cache pages that are ‘stolen’ to use for other server memory requests. Stolen pages are used for several miscellaneous server purposes such as procedure cache, sorting or for hashing operations (query workspace memory). It is also used as a generic memory store for allocations that are smaller than 8 KB, to store internal data structures such as locks, transaction context, and connection information. This is a simple way of allocating memory to routine tasks but if a server receives a huge rate of ad-hoc queries, it can lead to trouble. Unless SQL Server determines that it can automatically parameterize a query, or it determines that it is the same query, it is forced to generate a new execution plan. You are seeing the consequences of this with the starvation of memory for data buffers.
The first thing to check is the number of query plans being compiled. The SQL Server Performance Monitor will show many SQL Compilations/sec are being done. Ideally, the ratio of SQL Recompilations/sec to Batch Requests/sec should be very low.
DBCC MemoryStatus will indicate a rise in the number of stolen pages, and there are a host of DMVs that can point to the cause of the problems.
Once you are sure as to what is causing the problem, then there are several things you can do. Ideally, the best cure is to use stored procedures. If this solution isn’t available for some reason, then develop parameterized queries in the applications so that SQL Server is enabled to reuse an existing plan. It is possible to force SQL Server to use a compiled plan for ad-hoc queries, but as it is so easy to form correct parameterised queries, this is hardly worth considering.
Let’s show you an example. First, we’ll prepare a ‘person’ table and populate it with, say, half a million rows.
*/
IF NOT EXISTS (SELECT 1 FROM information_schema.tables
   WHERE table_name LIKE ‘Person’)
CREATE TABLE [dbo].[Person](
   [Person_id] [int] IDENTITY(1,1) NOT NULL,
   [ContactTitle] [varchar](50) NOT NULL CONSTRAINT [DF_Person_ContactTitle]  DEFAULT (”),
   [Title] [varchar](20) NOT NULL CONSTRAINT [DF_Person_Title]  DEFAULT (”),
   [FirrstName] [nvarchar](50) NOT NULL CONSTRAINT [DF_Person_FirstName]  DEFAULT (”),
   [NickName] [nvarchar](50) NOT NULL CONSTRAINT [DF_Person_NickName]  DEFAULT (”),
   [LastName] [nvarchar](50) NOT NULL CONSTRAINT [DF_Person_creator]  DEFAULT (USER_NAME()),
   [DateOfBirth] [datetime] NULL,
   [insertiondate] [datetime] NULL CONSTRAINT [DF_Person_insertiondate]  DEFAULT (GETDATE()),
   [terminationdate] [datetime] NULL,
CONSTRAINT [PK_dbo_Person] PRIMARY KEY CLUSTERED
(
   [Person_id] ASC
)WITH (PAD_INDEX  = OFF, STATISTICS_NORECOMPUTE  = OFF, IGNORE_DUP_KEY = OFF, ALLOW_ROW_LOCKS  = ON, ALLOW_PAGE_LOCKS  = ON) ON [PRIMARY]
) ON [PRIMARY]
/*Now we are going to simulate a programmer failing to come to grips with how to get information from a table and trying to do it by iterating through the rows using Ad-Hoc queries
*/
SET NOCOUNT ON –as we don’t want it
–Lets start with a clean sheet.
CHECKPOINT –Writes all data pages that have been entered into the buffer cache and modified but not yet written to disk, for the current database to disk.
GO
DBCC DROPCLEANBUFFERS –remove all buffers from the buffer pool.
DBCC FREEPROCCACHE –Removes all elements from the plan cache
GO
–We’ll create a temporary table to put our results into
–drop the temporary table if it exists and create it
IF EXISTS (SELECT 1 FROM tempdb.information_schema.tables
   WHERE table_name LIKE ‘#names%’) DROP TABLE #names
CREATE TABLE #names ([name] VARCHAR(80))
–now let’s simulate a simple loop through a table looking for a particular name in a “Person” table, assuming that a programmer is making the simple mistake of using procedural code
DECLARE @ii INT –iteration counter
DECLARE @id VARCHAR(10)
SELECT @ii=1
WHILE @ii<2000 –and just look through 2000 rows.
   BEGIN
   SELECT @ii=@ii+1, @id=CONVERT(VARCHAR(5),@ii)
   EXECUTE (‘insert into #names (name) Select Lastname from person where person_ID=’+@id)
   END
–Hmm. Lets see what is in the query-plan cache. Just peep at a sample of plans
SELECT TOP 5  TEXT
FROM sys.dm_exec_cached_plans
CROSS APPLY sys.dm_exec_sql_text(plan_handle)
WHERE cacheobjtype =’Compiled Plan’
/* look at that in the cache! Each execution has created a cached plan
insert into #names (name) Select Lastname from person where person_ID=2000
insert into #names (name) Select Lastname from person where person_ID=1999
insert into #names (name) Select Lastname from person where person_ID=1998
insert into #names (name) Select Lastname from person where person_ID=1997
insert into #names (name) Select Lastname from person where person_ID=1996
How much memory did that lot take up, I wonder?*/
SELECT SUM(size_in_bytes)/1024/1024 AS “Megs”
       (SUM(size_in_bytes)/1024)/COUNT(*) AS [Average size(k)],
       AVG(refcounts) AS “average ref.”
       AVG(Usecounts) AS “average use”
       ObjType
  FROM sys.dm_exec_cached_plans cp
    WHERE cacheobjtype =’Compiled Plan’
    GROUP BY Objtype
/*
Megs   Average size(k) average ref. average use ObjType
—— ————— ———— ———– ——–
78     40              2            1           Adhoc
So that simple loop in procedural code within an application took 78 megs of memory!
Now we’ve seen the damage, let’s see if using a prameterised query is any better. We’ll make up a little test harness.
*/
GO
CHECKPOINT
GO
DBCC DROPCLEANBUFFERS
DBCC FREEPROCCACHE
GO
SET NOCOUNT ON
— create a temporary table
IF EXISTS (SELECT 1 FROM tempdb.information_schema.tables
   WHERE table_name LIKE ‘#names%’) DROP TABLE #names
CREATE TABLE #names ([name] VARCHAR(80))
–create a temporary timer table
DECLARE  @log TABLE
   (
    Log_ID INT IDENTITY(1, 1),
    “Event”VARCHAR(40),
    “Stolen Pages”INT,
   “iterations”INT,
    InsertionDate DATETIME DEFAULT GETDATE()
   )
DECLARE @ii INT, @IterationsToDo INT
DECLARE @id VARCHAR(8)
DECLARE @StolenPageCounter INT
–DBCC MemoryStatus
–find out the stolen page counter value
SELECT @StolenPageCounter=cntr_value FROM SYS.SYSPERFINFO
   WHERE COUNTER_NAME=’STOLEN PAGES’
   AND OBJECT_NAME LIKE ‘%BUFFER MANAGER%’
SET @IterationsToDo=5000
INSERT INTO @log (event, “Stolen Pages”Iterations) SELECT ‘Ad-hoc queries’, @StolenPageCounter,@IterationsToDo
SELECT @ii=1
WHILE @ii<=@IterationsToDo
   BEGIN
   SELECT @ii=@ii+1, @id=CONVERT(VARCHAR(5),@ii)
   EXECUTE (‘insert into #names (name) Select Title + ” ”+Firstname+ ” ”+Lastname from person as philfactor where person_ID=’+@id)
   END
SELECT @StolenPageCounter=cntr_value FROM SYS.SYSPERFINFO
   WHERE COUNTER_NAME=’STOLEN PAGES’
   AND OBJECT_NAME LIKE ‘%BUFFER MANAGER%’
INSERT INTO @log (event, “Stolen Pages” Iterations) SELECT ‘Parameterised Queries’, @StolenPageCounter,@IterationsToDo
SELECT @ii=1
WHILE @ii<=@IterationsToDo
   BEGIN
   SELECT @ii=@ii+1
   /* the first time that the sp_executesql statement is executed,
   SQL Server generates a parameterized plan for the SELECT statement
   from person with id as the parameter. For all subsequent executions,
   SQL Server reuses the plan with the new parameter value */
   EXEC sp_executesql N’
insert into #names (name) Select Title + ” ”+Firstname+ ” ”+Lastname
from person as factorphil
where person_ID=@id’,
               N’@id int’,
               @id=@ii
   END
SELECT @StolenPageCounter=cntr_value FROM SYS.SYSPERFINFO
   WHERE COUNTER_NAME=’STOLEN PAGES’
   AND OBJECT_NAME LIKE ‘%BUFFER MANAGER%’
INSERT INTO @log (event,”Stolen Pages” SELECT ‘Completed parameterised query’, @StolenPageCounter
–first, we’ll see what cached plans we have.
SELECT  COUNT(*) AS [No.],
       CONVERT(NUMERIC(9, 2),
       SUM(size_in_bytes * 1.00) / 1024 / 1024) AS Mb,
       (SUM(size_in_bytes) / 1024)/COUNT(*) AS [Average size (K)],
       AVG(refcounts) AS “average ref.”
        AVG(Usecounts) AS “average use”
       ObjType
FROM     sys.dm_exec_cached_plans cp
GROUP BY Objtype
ORDER BY [Mb] DESC
/*
No.     Mb      Average size (K) average ref. average use ObjType
—— ——- —————- ———— ———– ——–
5003   195.82  40               2            1           Adhoc
8      0.26    33               1            4           View
1      0.04    40               2            5000        Prepared
1      0.01    8                1            5000        Proc
*/
SELECT   event,
       [Pages Stolen] = (SELECT “Stolen Pages”
                               FROM @log f
                               WHERE f . Log_ID = g . Log_ID + 1)-“Stolen Pages”
       [Time (Ms)] = DATEDIFF(ms, [InsertionDate],
                           (SELECT [InsertionDate]
                               FROM @log f
                               WHERE f . Log_ID = g . Log_ID + 1
                           )
                       )
FROM     @log g
WHERE    Log_ID < ( SELECT MAX (Log_ID) FROM @log )
/*
so we see that it is much faster to use parameterized queries and the number of stolen pages is far less
event                      Pages Stolen Time (Ms)
————————– ———— ———–
Ad-hoc queries             21193        3906
Parameterised Queries      4492         970
So now, lets pick out the two queries from the Procedure Cache, recognising them by the two strings I embedded into them
*/
SELECT  ‘parameterised query’ AS [query type],
       SUM(size_in_bytes)/1024 AS [memory consumed (K)],
       COUNT(*) AS [number of plans]
FROM sys.dm_exec_cached_plans
CROSS APPLY sys.dm_exec_sql_text(plan_handle)
WHERE TEXT LIKE ‘%factorphil%’
UNION ALL
SELECT  ‘Ad-Hoc query’ AS [query type],
       SUM(size_in_bytes)/1024 AS [memory consumed (K)],
       COUNT(*) AS [number of plans]
FROM sys.dm_exec_cached_plans
CROSS APPLY sys.dm_exec_sql_text(plan_handle)
WHERE TEXT LIKE ‘%philfactor%’
/*
query type          memory consumed (K) number of plans
——————- ——————- —————
parameterised query 3072                2
Ad-Hoc query        205728              5001
*/
GO
SELECT LEFT([type], 20) AS [type], SUM(single_pages_kb) AS [Total_kb]
FROM sys.dm_os_memory_clerks
WHERE TYPE IN (‘CACHESTORE_SQLCP’,’CACHESTORE_PHDR’,’CACHESTORE_OBJCP’)
GROUP BY TYPE
ORDER BY SUM(single_pages_kb) DESC
/*
we can see the huge figure again from the DMV sys.dm_os_memory_clerks
type                 Total_kb
——————– ——————–
CACHESTORE_SQLCP     202928
CACHESTORE_PHDR      312
CACHESTORE_OBJCP     8
but probably the best way of viewing the damage is from this DMV sys.dm_os_memory_cache_counters
*/
SELECT
   LEFT([name], 20) AS [name],
   LEFT([type], 20) AS [type],
   SUM([single_pages_kb] + [multi_pages_kb]) AS cache_kb,
   SUM([entries_count]) AS No_Entries
FROM sys.dm_os_memory_cache_counters
WHERE TYPE IN (‘CACHESTORE_SQLCP’,’CACHESTORE_PHDR’,’CACHESTORE_OBJCP’)
GROUP BY [type], [name]
ORDER BY cache_kb DESC
/*
name                 type                 cache_kb             No_Entries
————- ——————– ——– ——-
SQL Plans     CACHESTORE_SQLCP     202768   5005
Bound Trees   CACHESTORE_PHDR      312      10
Object Plans  CACHESTORE_OBJCP     8        0
Note that:
CACHESTORE_SQLCP are our ad-hoc cached SQL statements or batches that aren’t in stored procedures, functions or triggers.  Thes consist of dynamic ad-hoc SQL  sent to the server by an application.
CACHESTORE_PHDR are algebrizer trees for views, constraints and defaults.  An algebrizer tree is the parsed SQL text that resolves the table and column names.
CACHESTORE_OBJCP  are compiled plans for stored procedures, functions and triggers.
So there you have it. This is a problem that can be very insidious, but once you know what to watch out for, it is very easy to put right. You just make sure that the developers do not try using too many ad hoc queries.
*/


how to enable rebuild index

SELECT 'ALTER INDEX ' + QUOTENAME(I.name) + ' ON ' +  QUOTENAME(SCHEMA_NAME(T.schema_id))+'.'+ QUOTENAME(T.name) + ' REBUILD;'
FROM sys.indexes I
INNER JOIN sys.tables T ON I.object_id = T.object_id
WHERE I.type_desc = 'NONCLUSTERED'
AND I.name IS NOT NULL
AND I.is_disabled = 1
go


select
    sys.objects.name,
    sys.indexes.name,is_disabled,sys.objects.type,sys.objects.type_desc,sys.indexes.type_desc
from sys.indexes
    inner join sys.objects on sys.objects.object_id = sys.indexes.object_id
where sys.indexes.is_disabled = 1
order by
    sys.objects.name,
    sys.indexes.name

How to remove publication

How to remove publication  -script to remove publication in

===================
DECLARE @publicationDB AS sysname;
DECLARE @publication AS sysname;
SET @publicationDB = N'AdventureWorks';
SET @publication = N'AdvWorksProductTran';

-- Remove a transactional publication.
USE [AdventureWorks2012]
EXEC sp_droppublication @publication = @publication;

-- Remove replication objects from the database.
USE [master]
EXEC sp_replicationdboption
  @dbname = @publicationDB,
  @optname = N'publish',
  @value = N'false';
GO

SQL Blocking Query


/*
Discialmer:
The sample scripts are provided AS IS without warranty of any kind. The entire risk arising out of the use or performance of the sample scripts and documentation remains with you.
In no event I shall be liable for any damages whatsoever (including, without limitation, damages for loss of business profits, business interruption, loss of business information,
or other pecuniary loss) arising out of the use of or inability to use the sample scripts or documentation.

*/
 SET NOCOUNT ON

-- Checked for currenlty running queries by putting data in temp table
SELECT s.session_id
    ,r.STATUS
    ,r.blocking_session_id
    ,r.wait_type
    ,wait_resource
    ,r.wait_time / (1000.0) 'WaitSec'
    ,r.cpu_time
    ,r.logical_reads
    ,r.reads
    ,r.writes
    ,r.total_elapsed_time / (1000.0) 'ElapsSec'
    ,Substring(st.TEXT, (r.statement_start_offset / 2) + 1, (
            (
                CASE r.statement_end_offset
                    WHEN - 1
                        THEN Datalength(st.TEXT)
                    ELSE r.statement_end_offset
                    END - r.statement_start_offset
                ) / 2
            ) + 1) AS statement_text
    ,Coalesce(Quotename(Db_name(st.dbid)) + N'.' + Quotename(Object_schema_name(st.objectid, st.dbid)) + N'.' + Quotename(Object_name(st.objectid, st.dbid)), '') AS command_text
    ,r.command
    ,s.login_name
    ,s.host_name
    ,s.program_name
    ,s.host_process_id
    ,s.last_request_end_time
    ,s.login_time
    ,r.open_transaction_count
INTO #temp_requests
FROM sys.dm_exec_sessions AS s
INNER JOIN sys.dm_exec_requests AS r ON r.session_id = s.session_id
CROSS APPLY sys.dm_exec_sql_text(r.sql_handle) AS st
WHERE r.session_id != @@SPID
ORDER BY r.cpu_time DESC
    ,r.STATUS
    ,r.blocking_session_id
    ,s.session_id

IF (
        SELECT count(*)
        FROM #temp_requests
        WHERE blocking_session_id > 50
        ) <> 0
BEGIN
    -- blocking found, sent email.
    DECLARE @tableHTML NVARCHAR(MAX);

    SET @tableHTML = N'<H1>Blocking Report</H1>' + N'<table border="1">' + N'<tr>' + N'<th>session_id</th>' + N'<th>Status</th>' +
                     N'<th>blocking_session_id</th><th>wait_type</th><th>wait_resource</th>' +
                     N'<th>WaitSec</th>' + N'<th>cpu_time</th>' +
                     N'<th>logical_reads</th>' + N'<th>reads</th>' +
                     N'<th>writes</th>' + N'<th>ElapsSec</th>' + N'<th>statement_text</th>' + N'<th>command_text</th>' +
                     N'<th>command</th>' + N'<th>login_name</th>' + N'<th>host_name</th>' + N'<th>program_name</th>' +
                     N'<th>host_process_id</th>' + N'<th>last_request_end_time</th>' + N'<th>login_time</th>' +
                     N'<th>open_transaction_count</th>' + '</tr>' + CAST((
                SELECT td = s.session_id
                    ,''
                    ,td = r.STATUS
                    ,''
                    ,td = r.blocking_session_id
                    ,''
                    ,td = r.wait_type
                    ,''
                    ,td = wait_resource
                    ,''
                    ,td = r.wait_time / (1000.0)
                    ,''
                    ,td = r.cpu_time
                    ,''
                    ,td = r.logical_reads
                    ,''
                    ,td = r.reads
                    ,''
                    ,td = r.writes
                    ,''
                    ,td = r.total_elapsed_time / (1000.0)
                    ,''
                    ,td = Substring(st.TEXT, (r.statement_start_offset / 2) + 1, (
                            (
                                CASE r.statement_end_offset
                                    WHEN - 1
                                        THEN Datalength(st.TEXT)
                                    ELSE r.statement_end_offset
                                    END - r.statement_start_offset
                                ) / 2
                            ) + 1)
                    ,''
                    ,td = Coalesce(Quotename(Db_name(st.dbid)) + N'.' + Quotename(Object_schema_name(st.objectid, st.dbid)) +
                        N'.' + Quotename(Object_name(st.objectid, st.dbid)), '')
                    ,''
                    ,td = r.command
                    ,''
                    ,td = s.login_name
                    ,''
                    ,td = s.host_name
                    ,''
                    ,td = s.program_name
                    ,''
                    ,td = s.host_process_id
                    ,''
                    ,td = s.last_request_end_time
                    ,''
                    ,td = s.login_time
                    ,''
                    ,td = r.open_transaction_count
                FROM sys.dm_exec_sessions AS s
                INNER JOIN sys.dm_exec_requests AS r ON r.session_id = s.session_id
                CROSS APPLY sys.dm_exec_sql_text(r.sql_handle) AS st
                WHERE r.session_id != @@SPID
                    AND blocking_session_id > 0
                ORDER BY r.cpu_time DESC
                    ,r.STATUS
                    ,r.blocking_session_id
                    ,s.session_id
                FOR XML PATH('tr')
                    ,TYPE
                ) AS NVARCHAR(MAX)) + N'</table>';

    EXEC msdb.dbo.sp_send_dbmail @body = @tableHTML
        ,@body_format = 'HTML'
        ,@profile_name = N'DBMAIL'
        ,@recipients = N'sqldba2050@gmail.com'
        ,@Subject = N'Blocking Detected'
END

DROP TABLE #temp_requests

SQL WMI SQL CONFIGURATION MANGER NOT OPENING ISSUE

1) Connect the server
2) Open CMD with RUN as Administrator 

mofcomp "%programfiles(x86)%\Microsoft SQL Server\100\Shared\sqlmgmproviderxpsp2up.mof" 

3) Change SQL Build version and run it .


SQL JOB STATUS REPORT

SELECT  cast(serverproperty('Machinename') as varchar(255)) Servername,isnull(cast(serverproperty('Instancename') as varchar(255)),
cast(serverproperty('Machinename') as varchar(255))) Instancename,
    j.name AS JobName,
    Isnull(Substring(CONVERT(VARCHAR(8), js.last_run_date), 1, 4) + '-' +Substring(CONVERT(VARCHAR (8), js.last_run_date), 5, 2) + '-' +  Substring(CONVERT(VARCHAR( 8), js.last_run_date), 7, 2), '') AS [Run DATE]
         ,CASE
        WHEN j.enabled = 1 THEN 'Enabled'
        ELSE 'Disabled'
    END JobStatus
    ,CASE
        WHEN js.last_run_outcome = 0 THEN 'Failed'
        WHEN js.last_run_outcome = 1 THEN 'Succeeded'
        WHEN js.last_run_outcome = 2 THEN 'Retry'
        WHEN js.last_run_outcome = 3 THEN 'Cancelled'
        ELSE 'Unknown'
    END JobRunStatus
FROM msdb.dbo.sysjobs j
JOIN msdb.dbo.sysjobservers js on js.job_id = j.job_id
where j.name in('DatabaseBackup - SYSTEM_DATABASES - FULL',
'DatabaseBackup - USER_DATABASES - DIFF',
'DatabaseBackup - USER_DATABASES - FULL',
'DatabaseBackup - USER_DATABASES - LOG','DatabaseIntegrityCheck - SYSTEM_DATABASES',
'DatabaseIntegrityCheck - USER_DATABASES',
'IndexOptimize - USER_DATABASES','Update Log Growth Setting',
'UpdateStats CUSTOM DAILY - USER_DATABASES') and j.enabled=1
ORDER BY j.name, js.last_run_date, js.last_run_time

SQL Query1

SELECT DB_NAME(DATABASE_ID)DBNAME, [NAME] LOGICAL_FILENAME, [SIZE]*8/1024 SIZE_MB
FROM MASTER.SYS.MASTER_FILES
WHERE DB_NAME(DATABASE_ID) = 'TEMPDB'

SQL Query to get ALTER Database Modify command

SELECT  'USE [MASTER] ' + CHAR(13) + 'ALTER DATABASE [' + d.name + N'] '
    + 'MODIFY FILE (NAME = ''' + mf.name + N''', FILENAME= '''+ mf.physical_name+ N''')'
    + CHAR(13) + CHAR(10) + CHAR(13) + CHAR(10)
FROM    sys.master_files mf
    JOIN sys.databases d ON mf.database_id = d.database_id
WHERE   d.database_id > 4
        AND mf.type=1 and mf.physical_name like 'T:\%' and mf.name like 'WSS_%'


select 'ALTER DATABASE ['+ DB_NAME(database_id) +'] MODIFY FILE ( NAME = ''' +  name  + ''', FILEGROWTH = 100MB ) ' from sys.master_files 

SQL Query to find out SQL Blocking information

SET NOCOUNT ON
GO
SELECT SPID, BLOCKED, REPLACE (REPLACE (T.TEXT, CHAR(10), ' '), CHAR (13), ' ' ) AS BATCH
INTO #T
FROM sys.sysprocesses R CROSS APPLY sys.dm_exec_sql_text(R.SQL_HANDLE) T
GO
WITH BLOCKERS (SPID, BLOCKED, LEVEL, BATCH)
AS
(
SELECT SPID,
BLOCKED,
CAST (REPLICATE ('0', 4-LEN (CAST (SPID AS VARCHAR))) + CAST (SPID AS VARCHAR) AS VARCHAR (1000)) AS LEVEL,
BATCH FROM #T R
WHERE (BLOCKED = 0 OR BLOCKED = SPID)
AND EXISTS (SELECT * FROM #T R2 WHERE R2.BLOCKED = R.SPID AND R2.BLOCKED <> R2.SPID)
UNION ALL
SELECT R.SPID,
R.BLOCKED,
CAST (BLOCKERS.LEVEL + RIGHT (CAST ((1000 + R.SPID) AS VARCHAR (100)), 4) AS VARCHAR (1000)) AS LEVEL,
R.BATCH FROM #T AS R
INNER JOIN BLOCKERS ON R.BLOCKED = BLOCKERS.SPID WHERE R.BLOCKED > 0 AND R.BLOCKED <> R.SPID
)
SELECT N'    ' + REPLICATE (N'|         ', LEN (LEVEL)/4 - 1) +
CASE WHEN (LEN(LEVEL)/4 - 1) = 0
THEN 'HEAD -  '
ELSE '|------  ' END
+ CAST (SPID AS NVARCHAR (10)) + N' ' + BATCH AS BLOCKING_TREE
FROM BLOCKERS ORDER BY LEVEL ASC
GO
DROP TABLE #T
GO

SQL Query to get Database size infromation

SELECT Name,
[Filename],
CONVERT (Decimal(15,2),ROUND(a.Size/128.000,2)/1024) [Currently Allocated Space (GB)],
CONVERT (Decimal(15,2), ROUND(FILEPROPERTY(a.Name,'SpaceUsed')/128.000,2)/1024) AS [Space Used (GB)],
CONVERT (Decimal(15,2),ROUND((a.Size-FILEPROPERTY(a.Name,'SpaceUsed'))/128.000,2)/1024) AS [Available Space (GB)]
FROM dbo.sysfiles a (NOLOCK)
JOIN sysfilegroups b (NOLOCK) ON a.groupid = b.groupid
ORDER BY b.groupname;