/ August 2017

Measuring SQL Server Latch and Spinlock Contention

Measuring Latch Contention
A latch is like a lock on a piece of memory. As more threads get involved, they will start to compete to access the same pieces of memory, causing blocking. Blocking due to latch contention is exhibited in waits; but unlike a lock, a latch can be released as soon as the physical operation is completed.
The main sources of data about latches are two DMVs called sys.dm_os_wait_stats and sys.dm_os_latch_stats. The details of the values stored in these DMVs will be examined later in an explanation of latch modes and latch types, but for the purposes of recognizing the symptoms, a brief explanation will suffice. The DMVs are restarted when the service restarts, or when the DBCC SQLPERFcommand is called to clear them, as in the following code:
DBCC SQLPERF('sys.dm_os_wait_stats', CLEAR);
DBCC SQLPERF('sys.dm_os_latch_stats', CLEAR);
Among the columns of the DMV sys.dm_os_wait_stats are ones called wait_type, wait_time_ms and waiting_tasks_count. These three columns represent the wait type, the total number of milliseconds that have been spent waiting on this wait type, and the number of times this type of wait has occurred, respectively. Wait types that associate with latches start with LATCH_, PAGELATCH_, or PAGEIOLATCH_.
Dividing the total wait time by the number of waits will give an average wait time (I’d recommend wrapping the waiting_tasks_count column in the NULLIF function to avoid a division by zero error). By querying this DMV repeatedly over time (as in the following example, further illustrated in Figure 1), a picture can be built up of the frequency of latch waits, along with the amount of time the system must wait for these latches. This picture allows a database administrator to understand what kind of behavior is being exhibited — whether it matches Figure 7.1 or Figure 7.2.
SELECT
wait_type,
wait_time_ms,
waiting_tasks_count,
wait_time_ms / NULLIF(waiting_tasks_count,0) AS avg_wait_time
FROM sys.dm_os_wait_stats
WHERE wait_type LIKE 'LATCH_%'
OR wait_type LIKE 'PAGELATCH_%'
OR wait_type LIKE 'PAGEIOLATCH_%';
C 07f 004
Figure 1.
The DMV called sys.dm_os_latch_stats lists similar statistics for latch classes.
Measuring spinlock contention
For the time being, you can think of a spinlock as a latch, except that if the memory needing access is not available, the spinlock will keep checking it (known as spinning) for a while. There is slightly more to it, but we won’t go into that here.
The main DMV for spinlocks is sys.dm_os_spinlock_stats. The metrics of concern for spinlocks are around collisions and spins_per_collision, which are both columns in this DMV, along with the name column for the type of spinlock. Here is an example of using sys.dm_os_spinlock_stats (code file Ch7Symptoms.sql), further illustrated in Figure 2:
SELECT name, collisions, spins_per_collision
FROM sys.dm_os_spinlock_stats
ORDER BY spins_per_collision DESC;
C 07f 005
Figure 2.
The sys.dm_os_spinlock_stats DMV can also be cleared using DBCC SQLPERF.

Spinlocks in SQL Server

Why do we need Spinlocks?

As I have already pointed it out last week, it doesn’t make sense to put a latch in front of every shared data structure, and synchronize the access to the data structure across multiple threads with the latch. A latch has a huge overhead associated with it: when you can’t acquire a latch (because someone else has already an incompatible latch acquired), the query is forced to wait, and enters the SUSPENDED state. The query waits in the SUSPENDED state until the latch can be acquired, and afterwards moves on into the RUNNABLE state. The query remains in the RUNNABLE state as long as no CPU is available for query execution. As soon as the CPU is free, the query moves again into the RUNNING state and can finally access the shared data structure which is protected with the latch, which was successfully acquired. The following picture shows the state machine that SQLOS implements for the cooperative thread scheduling.


Because of the associated overhead of latches, it doesn’t make sense to protect “busy” data structures with a latch. For that reason SQL Server also implements so-called Spinlocks. A spinlock is like a latch a lightweight synchronization object used by the storage engine to synchronize thread access to shared data structures. The main difference to a latch is that you actively wait for the spinlock – without leaving the CPU. A “wait” on a spinlock always happens on the CPU, in the RUNNING state. You spin in a tight loop until the spinlock is acquired. It’s a so-called busy wait. The main advantage of a spinlock is that no context switches are involved when a query must wait on a spinlock. On the other hand busy waiting wastes CPU cycles that other queries might be able to use more productively.

To avoid waisting too much CPU cycles, SQL Server 2008 R2 and higher implements a so-called exponential backoff mechanism, where the thread stops spinning after some time and sleeps on the CPU. The interval after which a thread goes to sleep increases over time between the attemps to acquire the spinlock. This behavior can reduce the impact on CPU performance.

Spinlocks & Troubleshooting

The main DMV for troubleshooting spinlocks is sys.dm_os_spinlock_stats. Every row that is returned by that DMV represents one specific spinlock in SQL Server. SQL Server 2014 implements 262 different spinlocks. Let’s have a more detailed look at the various columns in this DMV.
  • name: The name of the spinlock
  • collisions: The number of times that threads were blocked by a spinlock when trying to access a protected data structure
  • spins: The number of times threads spinned in a loop trying to obtain the spinlock
  • spins_per_collision: Ratio between spins and collisions
  • sleep_time: The time that threads were sleeping because of a backoff
  • backoffs: The number of times that threads were backed-off to allow other threads to continue on the CPU
The most important column in this DMV is backoffs, because this column tells you how often a backoff event occurred for a specific spinlock type. And very high backoffs yield to high CPU consumption and a so-called Spinlock Contention in SQL Server. I have already seen SQL Server installations where 32 cores were running at 100% without performing any work – a typical symptom for spinlock contention.
To troubleshoot a spinlock contention problem in more detail you can use the XEvent sqlos.spinlock_backoff provided by Extended Events. This event is always raised when a backoff occurs. If you capture this event, you also have to make sure that you use a very good selective predicate, because backoffs will always occur in SQL Server. A good predicate can be a specific spinlock type, where you have already seen high backoffs through the above mentioned DMV. The following code sample shows how you can create such an XEvent session.


As you can see from the listing, I use here the histogram target to bucketize on the callstack. Therefore you can see which code path within SQL Server generated the highest backoffs for the specific spinlock type. You can even symbolize the call stack by enabling trace flag 3656. As a prerequisite you need to install the public symbols of SQL Server. Paul Randal (Blog, Twitter) has written a blog posting about it. Here you can see an output from this XEvent session.
sqldk.dll!XeSosPkg::spinlock_backoff::Publish+0x138
sqldk.dll!SpinlockBase::Sleep+0xc5
sqlmin.dll!Spinlock<129,7,1>::
SpinToAcquireWithExponentialBackoff+0x169
sqlmin.dll!lck_lockInternal+0x841
sqlmin.dll!XactWorkspaceImp::
GetSharedDBLockFromLockManager+0x18d
sqlmin.dll!XactWorkspaceImp::GetDBLockLocal+0x15b
sqlmin.dll!XactWorkspaceImp::GetDBLock+0x5a
sqlmin.dll!lockdb+0x4a sqlmin.dll!DBMgr::OpenDB+0x1ec
sqlmin.dll!sqlusedb+0xeb
sqllang.dll!usedb+0xb3
sqllang.dll!LoginUseDbHelper::UseByMDDatabaseId+0x93
sqllang.dll!LoginUseDbHelper::FDetermineSessionDb+0x3e1
sqllang.dll!FRedoLoginImpl+0xa1b
sqllang.dll!FRedoLogin+0x1c1
sqllang.dll!process_request+0x3ec
sqllang.dll!process_commands+0x4a3
sqldk.dll!SOS_Task::Param::Execute+0x21e
sqldk.dll!SOS_Scheduler::RunTask+0xa8
sqldk.dll!SOS_Scheduler::ProcessTasks+0x279
sqldk.dll!SchedulerManager::WorkerEntryPoint+0x24c
sqldk.dll!SystemThread::RunWorker+0x8f
sqldk.dll!SystemThreadDispatcher::ProcessWorker+0x3ab
sqldk.dll!SchedulerManager::ThreadEntryPoint+0x226

With the provided call stack, it is not that hard to identify in which area of SQL Server the spinlock contention occurred. In that specific call stack the contention occurred in the LOCK_HASH spinlock type that protects the hashtable of the lock manager. Every time when a lock or unlock operation in the lock manager is executed, a spinlock must be acquired on the corresponding hash bucket. As you can also see from the call stack the spinlock was acquired when calling the function GetSharedDBLockFromLockManager from the class XactWorkspaceImp. It’s an indication that a shared database lock was tried to be acquired, when connecting to a database. And this finally yielded to a spinlock contention in the LOCK_HASH spinlock with very high backoffs.

Latches

Why do we need Latches?

Latches were first introduced in SQL Server 7.0, when Microsoft first introduced row-level locking. For row-level locking it was very important to introduce a concept like latching, because otherwise it would give rise to phenomena like Lost Updates in memory. As I have stated above, a latch is a lightweight synchronization object used by the Storage Engine to protect memory structures used internally by SQL Server. A latch is nothing more than a so-called Critical Section in multi-threaded programming – with some differences.
In traditional concurrent programming, a critical section is a code path, which must always run single-threaded – with only one thread at a time. A latch itself is a specialized version of a critical section, because it allows multiple concurrent readers. In the context of SQL Server this means that multiple threads can concurrently read a shared data structure, like a page in memory, but writing to that shared data structure must be performed single-threaded.
A latch is used to cordinate the physical execution of multiple threads within a database, whereas a lock is used on a logical level to achieve the required isolation based on the chosen isolation level of the transaction. You, as a developer or DBA, can influence locks in some ways – e.g. through the isolation level, or also through the various lock hints that are available in SQL Server. A latch on the other hand, can’t be controlled in a direct way. There are no latch hints in SQL Server, and there is also no latch isolation level available. The following table compares locks and latches against each other.
Locks vs. Latches
As you can see from that table, latches also support more fine grained modes like Keep and Destroy. A Keep latch is mainly used for reference counting, e.g. when you want to know how many other latches are waiting on a specific latch. And the Destroy latch is the most restrictive one (it even blocks the KP latch), which is used when a latch is destroyed, e.g. when the Lazy Writer wants to free up a page in memory. The following table gives you an overview of the latch compatibility matrix in SQL Server.
Latch Compatibility Matrix
In the following short flipchart demo, I want to show you why latches are needed in SQL Server, and which phenomena would happen without them.


As you have seen in the previous flipchart demo, consistency can’t be achieved in SQL Server with locking alone. SQL Server still has to access shared data structures that are not protected by the lock manager, like the page header. And even other components within SQL Server that have single-threaded code paths are built on the foundation of latches. Let’s continue therefore now with the various latch types in SQL Server, and how you can further troubleshoot them.

Latch Types & Troubleshooting

SQL Server distinguishes between 3 different types of latches:
  • IO Latches
  • Buffer Latches (BUF)
  • Non-Buffer Latches (Non-BUF)
Let’s have a more detailed look at these 3 different variations. 
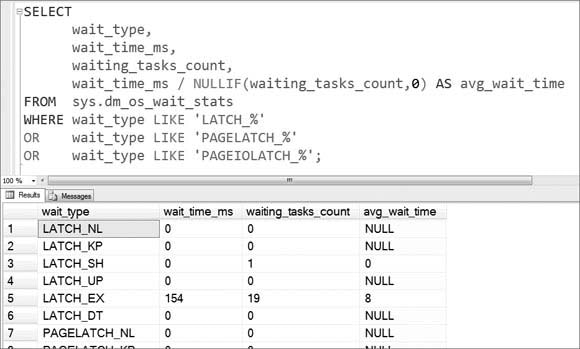
I/O Latches are used by SQL Server when outstanding I/O operations against pages in the Buffer Pool are done – when you read and write from/to your storage subsystem. For these I/O latches SQL Server reports a wait type that starts with PAGEIOLATCH_. You can see the waiting times introduced with these types of latches in the DMV sys.dm_os_wait_stats in the following picture.
PAGEIOLATCH
With these latches SQL Server makes sure that pages are not read concurrently multiple times into the buffer pool, and that pages are not discarded from the buffer pool, when they are currently accessed by a query. In addition to the I/O latches SQL Server also supports so-called Buffer Latches, which are used to protect the pages in the buffer pool from concurrent running threads. These are the latches that SQL Server uses to prevent Lost Updates in memory, as I have demonstrated in the previous flipchart demo. Without these kinds of latches, it would be possible to read and write a page concurrently in the buffer pool, which would give rise to corruption of the pages in main memory. SQL Server also reports the waits introduced by these latches with wait types starting with PAGELATCH_*. These wait types are again reported to you through the DMV sys.dm_os_wait_stats. The most important thing here is that you hit contention in main memory, when there is not the term IO in the wait type name.
PAGELATCH
And finally SQL Server internally uses so-called Non-Buffer Latches to protect shared data structures besides the buffer pool itself. SQL Server also reports these latches in the DMV sys.dm_os_wait_stats with wait types starting with LATCH_.
LATCVH
But the waits reported in this DMV for Non-Buffer Latches are just a summary view of all individual latches that SQL Server uses internally. You can find a further breakdown of the individual latches in a separate DMV – sys.dm_os_latch_stats:
Latch Statistics
SQL Server 2014 internally uses 163 latches to synchronize access to shared data structures. One prominent latch is FGCB_ADD_REMOVE, which protects the so-called File Group Control Block (FGCB) of a file group during certain operations like:
  • File growth (manually & automatically)
  • Adding/dropping a file from a file group
  • Recalculating proportional fill weightings
  • Cycling through a files of a file group during the round-robin allocation
When you see high waits on that specific latch, you mainly have problems with too many auto growth operations, and therefore bad default settings of your database. When a query tries to read/write a protected data structure and has to wait for a latch, the query is always put into the suspended state, and has to wait until the latch can be acquired successfully. Therefore the query always goes through the complete query life cycle consisting of the states RUNNING, SUSPENDED, RUNNABLE, and finally RUNNING again. For that reason, enforcing the protection of a shared data structure only makes sense when the query holds the latch for a long time. That is because changing the state of the query also means performing a context switch in the Windows OS, which is a very expensive operation in terms of introduced CPU cycles.
Therefore it doesn’t make sense to put a latch in front of a shared data structure which will be read or written very frequently and only for a very short amount of time. In that case the needed context switches will kill the overall performance of SQL Server, and it would take too much time to go through the complete query life cycle (RUNNING, SUSPENDED, RUNNABLE). That’s the area where SQL Server introduces so-called 
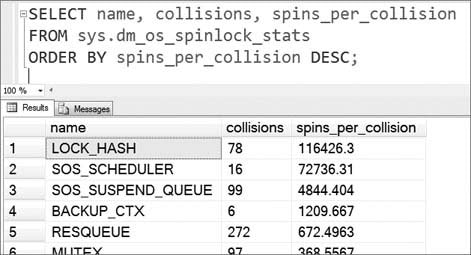
Spinlocks. The Lock Manager is a good example of such a data structure: it needs single-threaded access when locking and unlocking data items (like a record, a page, etc.). But when you look at sys.dm_os_latch_stats, you will find no latch that protects the Lock Manger itself. The corresponding hash bucket in the hashtable used by the Lock Manager is protected by a spinlock – the LOCK_HASH spinlock. The spinlock must be acquired before executing a lock or unlock operation through the Lock Manager. But today I am not going to talk about spinlocks, because I plan a dedicated blog posting just about them – so you will have to wait for that:-)

Summary

In this blog posting we have looked at latches in SQL Server. As you have seen latches are lightweight synchronization objects used by SQL Server to protect shared data structures in memory. SQL Server distinguishes between 3 different types of latches – IO Latches, Buffer Latches, and Non-Buffer Latches. You have also seen how you can troubleshoot latch waits with DMVs like sys.dm_os_wait_stats and sys.dm_os_latch_stats.
<Record id = "0" type ="RING_BUFFER_RESOURCE_MONITOR" time ="25451"><ResourceMonitor><Notification>RESOURCE_MEMPHYSICAL_HIGH</Notification><IndicatorsProcess>0</IndicatorsProcess><IndicatorsSystem>1</IndicatorsSystem><IndicatorsPool>0</IndicatorsPool><NodeId>0</NodeId><Effect type="APPLY_LOWPM" state="EFFECT_OFF" reversed="0">0</Effect><Effect type="APPLY_HIGHPM" state="EFFECT_ON" reversed="0">0</Effect><Effect type="REVERT_HIGHPM" state="EFFECT_OFF" reversed="0">0</Effect></ResourceMonitor><MemoryNode id="0"><TargetMemory>14859016</TargetMemory><ReservedMemory>36213696</ReservedMemory><CommittedMemory>218692</CommittedMemory><SharedMemory>0</SharedMemory><AWEMemory>0</AWEMemory><PagesMemory>74488</PagesMemory></MemoryNode><MemoryRecord><MemoryUtilization>100</MemoryUtilization><TotalPhysicalMemory>16776760</TotalPhysicalMemory><AvailablePhysicalMemory>15439316</AvailablePhysicalMemory><TotalPageFile>33551676</TotalPageFile><AvailablePageFile>31732832</AvailablePageFile><TotalVirtualAddressSpace>8589934464</TotalVirtualAddressSpace><AvailableVirtualAddressSpace>8553290232</AvailableVirtualAddressSpace><AvailableExtendedVirtualAddressSpace>0</AvailableExtendedVirtualAddressSpace></MemoryRecord></Record>

SQL Memory Related Counters

Key Performance Counters Related to memory : 

General Memory Counters :
Available Mbytes,
Pages Inputs / Sec,
Paging File

%Usage

Related to Memory Grants :

Granted Memory,
Maximum Memory,
Grants Outstanding,
Grants Pending

Related to SQL Server Buffer :

Lazy Writes / Sec,
PLE, Pages Reads & Writes,
ReadAhead,
Buffer Cache hit Ratio

If you decide to go little further and capture more in details on Memory Distribution

Procedure Cache Pages,
Stolen pages,
Total Server Mem,
Target Server Mem,
Data Pages,
Free Pages
Private Bytes,
Working Set are other key counters

You will be able to find all these in, Memory, Process, SQL Server memory manager & SQL Server Buffer manager

Memory Pressure

So far I touched on subjects that have been widely discussed in the industry. Today I would like to talk about a subject that you would hardly find information about:  memory pressure..  On a surface the subject appears simple but in reality this is not the case.

There are two types of memory pressure a process can be exposed to external and internal. To maximize its performance and reliability a process might want to react to both of them. External memory pressure might cause a process and whole system go into paging . Internal memory pressure might cause OOM conditions and eventual process's crash.

External memory pressure is controlled by Windows, operating system. There are two types of external memory pressure such as physical dynamic memory pressure and physical “static” memory pressure. The latter type happens when a system runs out of page file. This type of memory pressure might drive the whole system into OOM condition. You might have seen those pop ups in the right corner indicating that system runs low on virtual memory. In order to detect this type of pressure one needs to monitor the size of page file. Usually applications don’t do it.

The external dynamic memory pressure rises when Windows runs low on free RAM and about to start trimming existing working sets on the box, i.e paging. A process can monitor this type of pressure by leveraging memory resource notification API described here http://msdn.microsoft.com/library/default.asp?url=/library/en-us/memory/base/querymemoryresourcenotification.asp.  An application can have dedicated thread that listens on memory resource notifications. Keep in mind that these notificaitons are global, i.e. they are shared by all processes. There are two types of memory resource notifications that a thread can wait on: memory high and memory low. Before Windows starts paging it will turn on low memory resource notificaion. Applications’ threads that waiting on such notification will be waken up and given opportunity to shrink process’s memory usage before OS comes into the picture. This is very useful for highend services that have better idea than the operating system about their memory usage and what needs to be shrunk. Once memory goes back to normal Windows unsets the low memory resource notification. As you might expect, when Windows thinks there is a plenty of memory on the box, it turns on memory high resource notification. If both of the memory resource notifications are not set it means that system is in stable state and processes shouldn’t either grow or shrink.

There are two types of internal memory pressure such as physical memory pressure and Virtual Address Space, VAS, pressure. Depending on its memory manager there are several ways for a process to get into physical internal memory pressure. For example external pressure might cause a process to shrink. This might trigger process’s releasing memory which in its turn will trigger internal memory pressure. The other possibility to get into this type of pressure is if an administrator sets memory limits for a process. Once max is reached process will get into internal memory pressure. Usually application recovers from this type of pressure by shrinking internal caches and pools back to its memory manger. In cases when there is no external memory pressure there is no reason to free this memory back to operating system.  

VAS pressure is the most difficult one to detect and react to. VAS pressure could happen due to two reasons. The first reason is VAS fragmentation. It happens when  a process might have plenty of VAS regions but there is no a VAS region of a given size available. Currently there is no easy way to detect largest free VAS region. One could try to allocate a VAS region of given size to identify VAS pressure state. Be careful though, periodic attempt to allocate a VAS region of large sizes, say 4MB, might cause VAS fragmentation. This will happen if some component in the process keeps on allocating and caching VAS regions of smaller sizes, for example threads. The second reason for VAS pressure is the whole VAS could be consumed. In this case any VAS allocation fails. High-end servers have to be able to deal with VAS pressure especially on 32 bit platforms. Not recovering from VAS pressure might cause first process's  slowing down and then terminating. When an application detects VAS pressure it could react to it the same way as to internal physical pressure by shrinking caches and pools. In addition a process might decide to shrink thread pools, remove shared memory regions, unload dlls and etc…

To correctly handle all types of memory pressure you will need to build special infrastructure. As it turns out this type of infrastructure is not simple. Just consider different states your process can be in at the same time. For example Windows might indicate that there is plenty of external RAM, enabling your process can grow, but at the same time your process can hit internal physical or VAS pressure. 

There are several implementation caveats that you need be aware of when implementing such infrastructure.  If your process slow enough to react to external pressure Windows will page your process out. Then it will turn off low memory resource. Once it seesm that there is plenty of memory it will turn on high memory resource. In this case you might see that high is on and start allocating more memory even though your process is paged out. This might cause your process to page against itself. It seems that when deciding to grow you need to take your working set into account, please remember neither AWE pages nor large pages are part of working set so you have to be really careful. The other caveat is when running low on paging file, Windows won’t turn on low memory resource even though it is about to return OOM for next memory requests. In addition keep in mind that your well behaved application can be affected by a bad one that doesn’t care about memory state on the box at all.

Understanding memory pressure should really help you when we will be discussing SQL Server memory manger. Moreover having this knowledge should help you to administrate SQL Server and other applications sharing a box

Checkpoint and Lazy Writer are somewhat similar. They both write pages from buffer pool memory to the disk. So, what is the difference?

CHECKPOINT‘s goal is to shorten database recovery time (e.g. after a server crash), therefore increasing availability. It makes data files not lagging too much behind the transaction log. Recovery of every single database starts at the last checkpoint and rolls-forward all the transaction log records from that point on. If checkpoint was long time ago, it could be that amount of log to roll forward is huge and it can take considerable time. During that time your database is unavailable, affecting availability (you have longer downtime). More frequent checkpoints means less amount of log needed to roll-forward, resulting in faster recovery. Too frequent checkpoints make buffer pool caching less efficient and can negatively affect performance. E.g. you don’t want to checkpoint every second. Frequency of automatic checkpoint is determined by recovery interval option and the log generation rate, and usually is around every 1 minute. Some TSQL commands also do a checkpoint inside, like BACKUP DATABASE command for example. Such checkpoints are called “Internal”. And we can do a manual checkpoint by invoking a CHECKPOINT tsql command.
LAZY WRITER purpose is to release the buffer pool memory (for pages cached in buffer pool) when memory pressure occurs. When more memory is needed (e.g. for bringing in new pages to the cache), lazy writer responds to a memory pressure releasing the “coldest” pages from the buffer pool, and makes more memory available for new pages to come in. And that is normal to see that lazy writer occasionally “makes a room”. But if lazy writer constantly has a lots of work to do, starting to purge pages that are not old at all (you see ‘Buffer Node:Page Life Expectancy’ perfmon counter stays below DataCacheSizeInGB/4GB *300) – you have a problem with buffer cache memory. You do not want pages flow though the buffer cache like a rapid river. You want them to stay there and be reused, read/written and rewritten again in-memory and not the disk which is slow compared to memory, as long as possible. Low page life expectancy nullifies buffer caching purpose, affecting performance.
They both write in-memory pages to the data files on the disk. But Which pages, when, and do they release memory or not – there is the difference!
CHECKPOINT writes only dirty pages pages to the disk (dirty = changed in memory since the last checkpoint, not yet written/checkpointed to disk), making them “clean”. Checkpoint does not release any memory, the pages STAY in memory, they are not removed from the buffer pool!
LAZY WRITER looks for least recently used (“cold” = least recently read or written, not accessed in recent time) pages in the buffer pool, and releases the memory taken by them. Lazy writer releases both dirty and clean pages. Clean pages can be released without writing to disk, but dirty pages must first be written to the disk (“flushed” to the disk and become “clean”) and then buffer pool memory can be released. So, total number of pages that lazy writer releases can be higher than the number of pages lazy writer writes to the data files, because “clean” pages can be released without writing them to disk. The final result of the lazy writer is less buffer pool memory used, therefore more memory available for the fresh pages in the buffer pool.
There is another difference: checkpoint process is more efficient in writing to the disk because it can group subsequent pages into larger disk IOs, e.g. 128KB IO size. It internally uses WriteFileGather Windows API function. For details, see here and here. Lazy writer can only write 8K pages. Therefore checkpoint disk throughput is much better than lazy writer’s.
How to track their activity?
Easiest is probably through the performance counters:


Using perfmon graph, we can see checkpoint is happening here about every 1 minute, and writes up to 7 000 pages per second (almost 60 MB/sec):

SQL Server Memory

Image result for sql server memory architecture

Image result for sql server memory architecture


Image result for sql server memory architecture